Massively Parallel Processing (MPP) databases usually use large amount (10s to 100s) of servers to process queries. They are built to manage with a small number of very hard, complex parallel queries (mostly containing multiple JOIN operations) that process large amount of data. Every server in such databases (segment server) stores and processes its own part of every table. Every query needs every part of its output data to be ready to finish. Thus, the whole MPP database works with the speed of the slowest server in the system. That’s why there are some nuances in administering and monitoring such systems, for example:
- If the data is distributed not equally among the segment servers (the data has “skew”), then database’s performance may be significantly degraded. We need to monitor data distribution between segment servers and choose correct columns for using as distribution key in tables.
- Degradation of the performance of one of segment servers (disk io, CPU) will lead to entire database begins to work slower. We always need to compare load and performance of every server in the cluster to prevent performance degradation.
The most popular MPP databases are HP’s Vertica, EMC’s Greenplum, Open Source Postgres XL and some databases that use Hadoop stack (Hive, Impala, Kognitio, etc.). It is a good topic for one more article to describe and compare them all, I hope I will do it sometimes later. Now I would like to describe monitoring of such system using as an example EMC Greenplum database.
As every decent system administrator, I started to set up monitoring and alerting system with Nagios and Zabbix. But further I explored the possibilities of this two more I understood that they are not enough for monitoring MPP database:
- Both Nagios and Zabbix are good in getting standard servers metrics – CPU load, mem usage, disk space, etc. But configuring these systems to work with your special metrics is not quite simple – you need to create your own scripts-agents to send metric’s data to Zabbix/Nagios server;
- It’s almost impossible to create an alert/chart in Nagios and Zabbix based on complicated combination of multiple metrics (ex: avg(MetricA-MetricB)*10/MetricC);
- We all are a little bit hipsters 🙂 We want to have a beautiful data visualizing tool: chart overlay, drag-n-drop, scaling, etc. Zabbix and Nagios are not good for this.
That’s why I decided to build monitoring and alerting tool based on Graphite + Grafana + Diamond. A short how-to is in this article.
First, I suggest using a separate machine for monitoring and alerting purposes. Using MPP Database’s segment for hosting monitoring tools is a very bad idea, using master or secondary (redundant) master is better, but it’s still quite dangerous. So if it is possible, prepare a separate machine with CentOS (or Redhat) that has a network access to all machines in your database cluster.
Let’s start with installing graphite, starting from version 0.9.0 it’s quite simple. You can try installing it from pip, or use yum package:
yum --nogpgcheck install graphite-web graphite-web-selinux mysql mysql-server \
MySQL-python python-carbon python-whisper
service mysqld start
/usr/bin/mysql_secure_installation
#then edit/etc/graphite-web/local_settings.py:
DATABASES = {
'default': {
'NAME': 'graphite',
'ENGINE': 'django.db.backends.mysql',
'USER': 'graphite',
'PASSWORD': 'your_pass',
'HOST': 'localhost',
'PORT': '3306',
}
}
#creating the user from the above config
mysql -e "CREATE USER 'graphite'@'localhost' IDENTIFIED BY 'your_pass';" -u root -p
mysql -e "GRANT ALL PRIVILEGES ON graphite.* TO 'graphite'@'localhost';" -u root -p
mysql -e "CREATE DATABASE graphite;" -u root -p
mysql -e 'FLUSH PRIVILEGES;' -u root -p #just apllying changes to the database
/usr/lib/python2.6/site-packages/graphite/manage.py syncdb
service carbon-cache start
service httpd start
#You can edit metrics's storing frequency and other settings in
#/etc/carbon/storage-schemas.conf
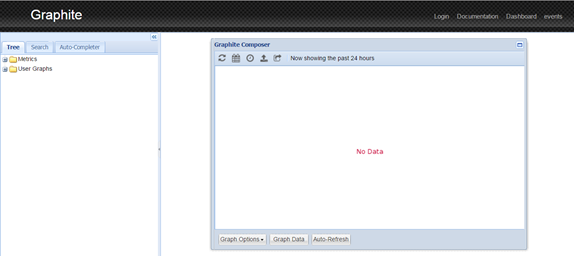
After installing you should be able to log in Graphite web interface on port # 80:
Now let’s test our graphite. Log in on your monitoring machine and execute the following:
echo "Folder.Test 1 $(date +%s)" |nc localhost 2003
After that you must be able to see your new metric in graphite browser:
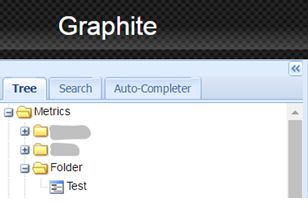
Clicking on the metric name will open the chart for this metric. Note that for the first time the line will not be visible because it contain only one dot.
By default your metric is located in whisper DB file in /var/lib/carbon/whisper/Folder/Test.wsp. You can delete and move metrics between folders and installations simply deleting and moving their files.
Now we need to install Grafana – a very powerful web-based dashboard editor and, starting from version 4.0, alerting software. It provides flexible chart editor, data visualizing panels, email & slack alerts based on Graphite’s data.
Installing is very simple: just install the deb/rpm package from the official download page, edit the port (and, optionally, other settings like alerting addresses, smtp server, etc.) in /etc/grafana/grafana.ini, and start grafana by starting the grafana-server service. After starting the service you should be able to open grafana in your browser on specified port.
Let’s create a Graphite data source by clicking Menu (grafana logo on right top of the screen) -> Datasources -> Add data source. Here is an example:
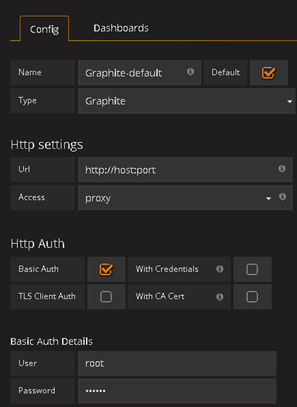
Test connection should work well after that.
After that create a dashboard (Menu -> Dashboards -> New) and add a single Graph panel to your dashboard. Click Pannel title -> Edit -> Metrics and select your Folder.Test metric. You should see your chart now. Ta-daa!
At this point I suggest you to take a break and to play with grafana a lot. Try different styles of lines, metric types, time ranges, templating, combining metrics and especially – applying graphite functions on your data. Feel the power of Grafana + Graphite – there is nothing impossible for this duet! After understanding of all its possibilities you can predict what data you will need to get from your system. It can be system data from your hardware (CPU, Memory and disks load), database data (number of running queries and active sessions), data statistics (daily ETL load, number of objects in the database), etc.
After that you will have approximate list of metrics that you need to mine from your system.
Getting data statistics is better directly from your ELT/ETL engine. For example, both SAS and Informatica engines allow you to send data from their jobs/mapping. This will help you to better understand what is happening in your data load processes.
Application-level (RDBMS) data can be retrieved by monitoring scripts (bash/python/perl are good for this) running every N minutes in cron. Don’t be afraid of sending large amounts of metrics – we collect thousands of metrics every minute, using virtual machine with 16 Gb of RAM and 4 CPU’s as a monitoring host, and everything works fine. Data is your friend here, more you have – more interesting trends you can discover.
To collect hardware data, you can use Diamond – a simple python daemon , that uses python scripts-collectors to retrieve various metrics from operating system and it’s applications. There is a huge list of available collectors here. Diamond is setup on all servers in you cluster.
And here is the script of installing diamond:
yum install build-essentials python-dev python python-devel psutil python-configobj
#wget and unzip https://github.com/python-diamond/Diamond
make install
cp /etc/diamond/diamond.conf.example /etc/diamond/diamond.conf
#edit the/etc/diamond/diamond.conf, set you graphite host and port, metric send frequency, etc.
#remove unused collectors from /usr/share/diamond/collectors/
diamond-setup #interactively set up cillectors settings
/etc/init.d/diamond start
With Diamond you can add new hardware monitoring as easy, as you do it in Nagios and Zabbix, and use the power of Graphite’s metric query language to analyze it.
Now, when you have all your systems, statistics and monitoring data in graphite, it’s time to get the profit. Here are my suggestions:
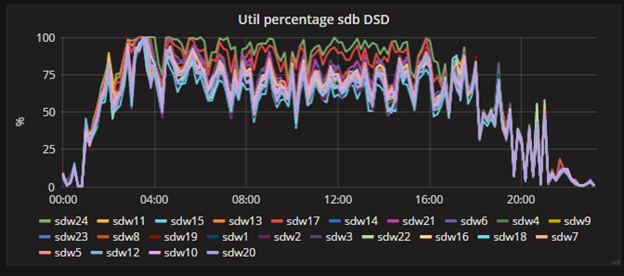
1) It’s all about the disks. Use the diamond’s disk IO collector to get disks’s utilization percentage, iops, await and service time. The main metric here is disk utilization percentage – it shows the “current load” of your disk. In fact, it is a percentage of time (very small period) that the disk was actually working with data. The second one – IOPS (input-output operation per second) – shows the useful work. If disk utilization is high for a long time, and IOPS is low (for getting max IOPS read your disk’s spec, but don’t forget to take into account your RAID factor) – something is wrong and your system doesn’t show optimal performance. Also, getting 100% utilization for a long time (with also high IOPS) shows that you need an upgrade as soon as possible – traditional hard drives (not SSD) don’t like working 100% time in long terms and start dying. This situation is hard drive’s nightmare: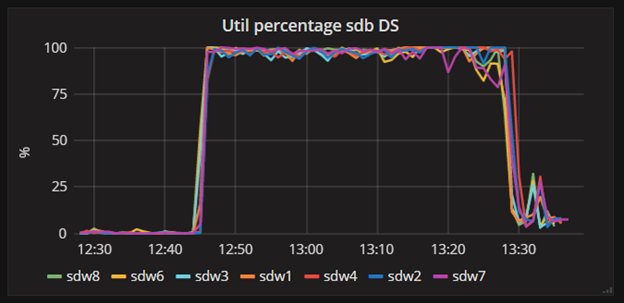
And this is normal well-balanced system’s load:
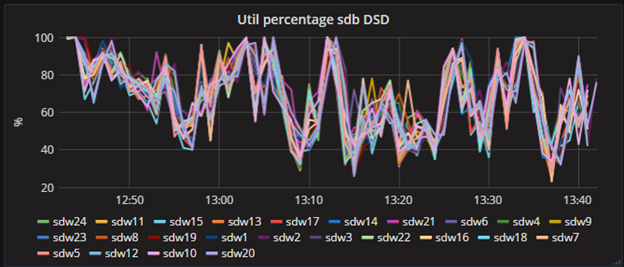
2) MPP systems work with worst segment’s speed. You need to figure out segments with disk utilization, CPU or memory load much higher than the other segments – such situations are performance problems. There are two reasons of misbalance of load may occur:
a) Data skew – for example, table may be shared not equally between the segments, and processing it’s rows may cause one segment to process more data then the other;
b) Hardware problem – for example, there can be a side process of one of the servers that uses CPU’s very intensively.
That’s what I am talking about:
Look at this two guys at the top of the chart – for some reason they are definitely working harder, then the others.
You can easily setup alert rule for such situations. For example:
sum(maxSeries(Cluster.*.iostat.sd[ab].util_percentage),scale(avg(Cluster.*.iostat.sd[ab].util_percentage),-1))
That will give you the difference between the average cluster load and the maximum one. 10% difference between them for a long time will definitely show a problem.
Also, try to set up a segment data amount chart to monitor data misbalance.
3) Collect all the data you have. Seriously, collect all. There are so much interesting trends that you can analyze on long periods of time – data size growing, daily load and so on.
I hope this little article will help you to deal with your cluster monitoring and you will like your new visualizing toy.

Nice article, keep them coming.
LikeLike